Diversity Makes Crop Insurance Special
Congress made crop insurance a cornerstone of U.S. farm policy for numerous reasons.
It is efficiently delivered by the private sector. Farmers and insurers help fund the system so taxpayers aren’t on the hook for the entirety of disaster aid. Payments get into the hands of farmers after disaster strikes within days, not years, but only after the claim is verified. And it’s easily tailored to the farmer’s needs no matter where they grow or what they put in the ground.
This kind of regional and crop diversification is often overlooked during farm policy debates, but it is a big part of crop insurance’s popularity in the countryside. For years, U.S. farm policy was criticized for primarily focusing on a few crops in the South and Midwest while leaving others – namely specialty crops and livestock – with little support.
That’s no longer the case thanks to smart investments in crop insurance. Now farmers and ranchers have a safety net whether they raise cattle, corn, cotton, canola, cranberries, citrus, cucumbers, cabbage, or hundreds of other crop combinations.
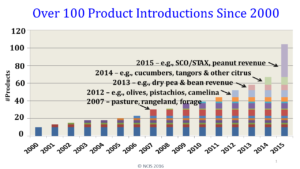
The chart below shows the improved availability of crop insurance products over the years, including coverage for lots of fruits and vegetables and protection for pasture, rangeland, and forage.

And that has translated into more farmers from outside the traditional farming belt purchasing risk protection, which has decreased taxpayers’ exposure to agricultural disasters.
Check out the participation growth in these states – the 20 fastest growing in the country – over the past 15 years.
| State | 2001 Insured Acres | 2015 Insured Acres* | % Increase | |
| 1. | Nevada | 8,792 | 1,834,421 | 20,765% |
| 2. | New Hampshire | 9,885 | 302,772 | 2,963% |
| 3. | Vermont | 53,771 | 1,293,322 | 2,305% |
| 4. | New York | 598,110 | 12,258,266 | 1,950% |
| 5. | Connecticut | 27,200 | 233,589 | 759% |
| 6. | Wyoming | 357,930 | 1,894,014 | 429% |
| 7. | Maine | 100,866 | 499,704 | 395% |
| 8. | Utah | 100,807 | 489,213 | 385% |
| 9. | New Mexico | 620,312 | 2,720,537 | 339% |
| 10. | Pennsylvania | 978,759 | 3,919,801 | 300% |
| 11. | Arizona | 388,190 | 1,216,915 | 213% |
| 12. | Texas | 16,124,120 | 45,988,387 | 185% |
| 13. | Kentucky | 1,864,327 | 4,050,009 | 117% |
| 14. | Colorado | 3,580,621 | 7,178,023 | 100% |
| 15. | Maryland | 638,568 | 1,147,376 | 80% |
| 16. | California | 4,010,128 | 6,759,327 | 69% |
| 17. | Florida | 1,523,472 | 2,526,249 | 66% |
| 18. | Ohio | 4,390,250 | 6,981,914 | 59% |
| 19. | Virginia | 933,335 | 1,451,435 | 56% |
| 20. | Wisconsin | 3,547,633 | 5,337,156 | 50% |
*Includes livestock gross margin protection insurance
Amazingly, some farm policy critics want to unravel this success, which would send us back to the days of unbudgeted, taxpayer-funded, and after-the-fact disaster aid. Their legislative proposals to limit participation and cap insurance benefits to some farmers would even disproportionately harm specialty crop growers in areas outside the nation’s breadbasket.
It doesn’t make much sense. Then again, neither does attacking the tiny sliver of the federal budget dedicated to underpinning America’s food and fiber supply.

